A SIF Precursor List Only Counts If It Was Written First
A serious injury and fatality precursor programme predicts nothing unless the list was fixed before the incidents it sorts and can be scored against deaths it failed to anticipate.
A contractor steps over a pipe rack, puts a boot on a grating panel that nobody bolted down, and catches the handrail on the way through. No injury. It goes on the log as a near miss, low severity, closed with a toolbox talk and a note to maintenance.
Six weeks later a different contractor steps on a different unbolted panel and does not catch the handrail. In the review that follows, the first event is pulled back out of the log and reclassified as a serious injury and fatality precursor. It goes into the quarterly deck as proof that the programme is working.
It is proof of nothing except that the site could recognise a pattern once the pattern had produced a body. That is the standard failure mode of SIF precursor programmes, and it is worth being precise about why the idea exists in the first place, because the underlying observation is sound.
The decoupling is real, and narrower than the slide says
In the United States, the two federal series do point in different directions. Private industry total recordable case rates fell from 3.0 cases per 100 full-time equivalent workers in 2015 to 2.3 in 2024, the lowest in a series going back to 2003, per the Bureau of Labor Statistics Survey of Occupational Injuries and Illnesses and the 2015 archived release. Over the same span, the Census of Fatal Occupational Injuries recorded 4,836 fatal work injuries in 2015 at a rate of 3.38 per 100,000 full-time equivalent workers, and 5,070 in 2024 at a rate of 3.3. Counts went up. The rate barely moved. Recordables fell by roughly a quarter.
Now the caveats, because they matter more than the headline. These are not the same measurement of the same thing. SOII is a sample survey of what employers wrote on their OSHA 300 logs, covering private industry, and it is bounded by federal recordkeeping rules. CFOI is a census of every fatal work injury in the country, assembled from multiple independent source documents, and it counts the self-employed, government workers, and people whose jobs sit outside regulatory coverage entirely. A gap between the two lines is partly a real safety signal and partly two different instruments pointed at two different populations.
There is a further complication for anyone treating a falling recordable rate as evidence of anything. Peer-reviewed work on the United States construction sector concluded that a meaningful share of the apparent decline in injury rates reflected changes in how injuries were treated, worker misclassification, and underreporting, and found that OSHA logs omitted a significant proportion of injuries identified in other data sources (Carre, Dong, Ringen and Welch, International Journal of Occupational and Environmental Health, 2007). A number that can be managed downward without touching a hazard is a poor baseline for anything.
And the direction of the fatality number is not always about hazard control either. BLS attributes most of the 2024 decline to a 16.2 percent drop in fatalities from exposure to harmful substances or environments, driven in turn by drug or alcohol overdoses falling to 410 from 512. That is a real improvement in the count. No grating-panel precursor list on any plant floor would have predicted it.
What a list has to survive to be called predictive
The strongest evidence for precursor thinking also constrains it. Analysis of roughly 23,000 serious occupational accidents investigated by the Dutch Labour Inspectorate found that major, fatal and non-fatal accidents share the same underlying causes, but only within the same hazard category (Bellamy, Safety Science, volume 71, 2015). That is the Netherlands, not the United States, so read the mechanism across and leave the numbers behind. The mechanism is the useful part: small events tell you about big events when both come out of the same hazard, and tell you nothing when they do not.
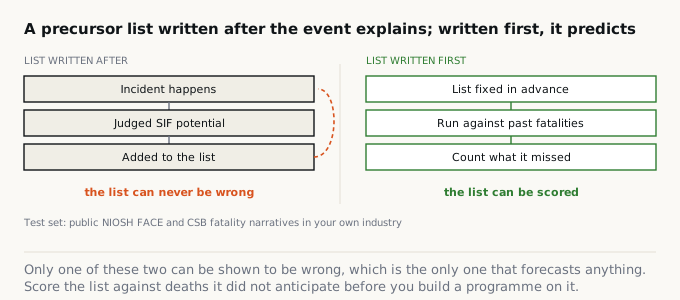
Which means a precursor list has two hard requirements. It must be hazard-specific, tied to named energy sources and named barriers rather than to behavioural categories. And it must be fixed in advance, because a list that gets amended after every fatality to include whatever just happened cannot be wrong, and a claim that cannot be wrong is not a prediction.
Most sites fail the second requirement quietly. The list is nominal; the real work is a judgement call made in a review room three weeks after the event, with the outcome already known. That produces a tidy retrospective taxonomy and zero forecasting power.
Run it backwards
The test is cheap and takes a working week. Freeze your current precursor list. Date it. Then pull twenty fatality or severe-injury narratives from your own industry that nobody on your team has read: NIOSH FACE investigation reports, which have run since 1982 and are written to identify hazards rather than assign fault, and CSB completed investigations for process events. OSHA severe injury reports work for volume.
Score each one blind. Would the frozen list have flagged the conditions present before that death? Count the hits. Then do the harder half: apply the same list to a month of your own routine observations and count how often it fires. A list that catches nineteen of twenty fatalities but also flags four hundred ordinary work steps a month has not predicted anything. It has renamed everything urgent.
The diagnostic
Pull up your precursor list and find its version history. Was every item on this list written before the most recent fatality in our industry, or did some of them get added because of it? If you cannot answer from the document itself, the programme is a filing system, not a forecast.
Compliance is not safety, and neither is a taxonomy. A precursor list earns the name when someone can hold it up against a death it did not anticipate and admit the list was wrong. Nothing that only ever agrees with the past is telling you about the future.