The safety dashboard that only tells you the past
Count the metrics on any safety dashboard. If most describe what already happened, you bought a compliance record, not an early-warning system.
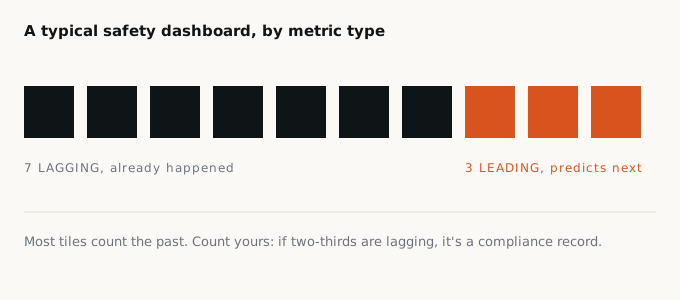
Buy almost any safety-tech platform and the first thing you’re shown is the dashboard: a wall of green tiles, a falling TRIR line, a recordable count trending toward zero. It reads as control. The question worth asking before you sign is simpler than the demo wants it to be: can this dashboard tell you whether someone is about to get hurt, or only whether someone already was?
Two kinds of number
Safety metrics split cleanly into two groups. Lagging indicators count things that have already gone wrong, recordable injuries, lost-time cases, rates like TRIR and DART. They are the backbone of OSHA recordkeeping and the BLS injury data, and they’re essential for comparison and compliance. They are also, by definition, a rear-view mirror.
Leading indicators, near-miss reporting rates, inspection completion, training currency, time-to-close on hazards, are the ones correlated with future outcomes. ISO 45001 frames performance evaluation around both. Most dashboards quietly under-weight the leading half, because it’s harder to instrument and less flattering to display: a falling injury count looks like success; a rising near-miss count looks like a problem, even though it’s often the opposite.
The tell
A dashboard’s composition reveals what it’s really for. If nearly every tile is a count of past harm, the tool exists to document your safety, not improve it, and the two are not the same. A site can post a spotless TRIR the quarter before a fatality, because the rare, serious event runs on different causes than the frequent, minor one.
Before you buy
Open the demo dashboard and count the metrics. For each, ask: does this describe something that already happened, or something that predicts what happens next? If more than two-thirds are lagging, you're buying a compliance record, regardless of what the sales deck calls it.
That ratio won’t tell you the product is bad. It will tell you what the product is for, and whether that matches the problem you’re trying to solve. If you need to prove compliance to a regulator, a lagging dashboard is fine. If you’re trying to stop the next incident, you need the half of the picture the demo tends to leave off.
Jurisdiction note: recordkeeping references are U.S. (OSHA, BLS). The lagging/leading distinction is universal; your reporting obligations are not.