Your culture score went up. That tells you almost nothing.
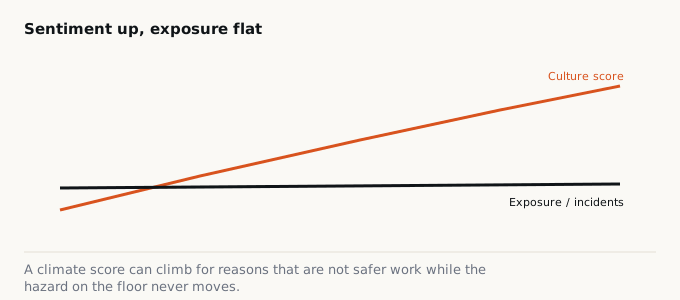
A rising safety-climate score measures who answered and how they felt, not whether exposure or incidents fell, so treat it as one input and never as an outcome.
The annual survey comes back and the deck writes itself. Composite score up four points. Management commitment to safety up six. A green arrow on the board slide, a line about momentum, and a quiet exhale from everyone who signed the budget for the engagement campaign. Then somebody asks the only question that matters: did anyone get hurt less? And the room goes quiet, because the survey cannot answer it.
This is the central confusion about safety-climate measurement. A perception survey is a good instrument pointed at the wrong target. It measures sentiment. It does not measure exposure, and it does not measure harm. Treat the score as an outcome and you will optimize the score. Treat it as one input among several and it becomes genuinely useful.
What the survey can actually tell you
The research base here is real, and worth respecting. Safety climate, the shared perception of how much safety actually counts when it competes with production, is one of the better-studied leading indicators in the field. Meta-analytic work by Christian and colleagues (2009) and by Beus and colleagues (2010) found consistent associations between climate perceptions and safety outcomes, with group safety climate emerging as the strongest correlate of injuries, and management commitment consistently among the strongest climate dimensions. CPWR, with NIOSH funding, built the Safety Climate Assessment Tool on exactly this foundation. So the instrument is not astrology. Used well, it flags where workers believe the system will fail them before it does.
But read the Beus finding closely, because it inverts the sales pitch. Their meta-analysis found that injuries predicted safety climate more strongly than safety climate predicted injuries. The arrow of causation runs partly backward: getting hurt changes how people rate the climate. A climate score is closer to a snapshot of mood than a durable forecast of harm.
Why the number moves without the risk moving
A climate score can rise for reasons that have nothing to do with safer work.
Most of these surveys are cross-sectional self-reports: same people, same moment, same response method. That design is a textbook host for common method variance, the bias that inflates apparent relationships when predictor and outcome both come from one person’s questionnaire. Other artifacts pile on: survey fatigue, negatively worded items that confuse respondents, and shrinking item variability as people learn to answer the expected way.
Then there is who answers. If your response rate climbs among office and supervisory staff while the crews doing the high-energy work opt out, your composite can rise while the perceptions of the people closest to the hazard never enter the average. A layoff that removes disgruntled veterans lifts the score. A well-run engagement push lifts the score. A workforce that has learned the survey is watched lifts the score. None of that is a reduction in exposure.
The convergence test
Before you report a culture-score trend as progress, line it up against three independent things: the participation rate and demographic mix of respondents (did the same population answer, at the same rate?), an exposure measure that does not come from the survey (hazard reports, high-energy observations, control-verification rates), and your serious-injury data. Does the rising score converge with an independent, non-survey signal that exposure actually fell, or is the score the only thing that moved? If the score is moving alone, you have measured sentiment, not safety.
Where it fits
ISO 45001 asks for both leading and lagging indicators and pushes organizations to weight the leading ones, precisely because you want warning before harm. A climate survey qualifies as a leading indicator. It does not qualify as a substitute for measuring the work.
Use it the way you would use a thermometer: a real reading, taken with a real instrument, that tells you something is off and nothing about why. When the score drops in one crew or one shift, that is a signal worth chasing to its source. When the composite drifts up year over year, resist the arrow. Ask who answered, whether the same population answered, and whether anything you can count outside the survey moved with it. A number that only agrees with itself is not evidence. It is an echo.